
Top Robinhood Stocks Based on Deep-Learning: Returns up to 30.93% in 14 Days
Top Robinhood Stocks
This forecast is part of the Robinhood Trades Package, one of I Know First’s algorithmic trading tools. The full investment universe includes the most traded stocks by Robinhood stock trading platform users. Based on it, I Know First AI Algorithm identifies the most promising stocks and produces forecasts that include:
- Top 10 stocks from Robinhood Trades for the long position
- Top 10 stocks from Robinhood Trades for the short position

Package Name: Robinhood Trades
Recommended Positions: Long
Forecast Length: 14 Days (6/29/23 – 7/13/23)
I Know First Average: 14.57%
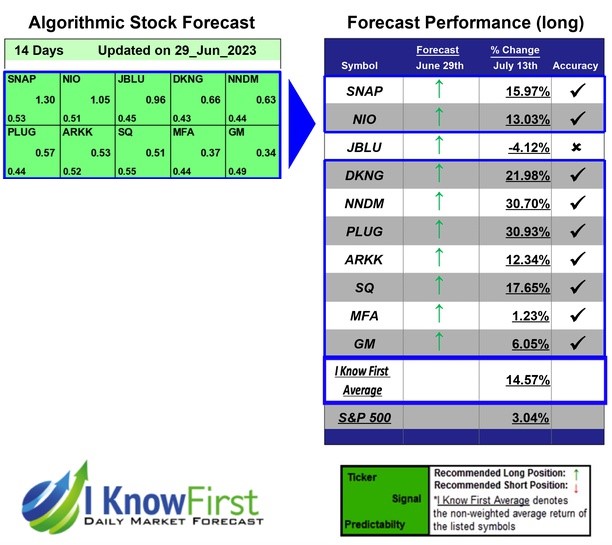

During the 14 Days forecasted period several picks in the Robinhood Trades Package saw significant returns. The algorithm has correctly predicted 9 out of 10 returns. PLUG was the top performing prediction with a return of 30.93%. Further notable returns came from NNDM and DKNG at 30.7% and 21.98%, respectively. This algorithmic forecast package presented an overall return of 14.57% versus the S&P 500’s performance of 3.04% providing a market premium of 11.53%.
Plug Power Inc., an alternative energy technology provider, engages in the design, development, commercialization, and manufacture of hydrogen fuel cell systems primarily for the material handling and stationary power markets in the United States. Plug Power Inc. was founded in 1997 and is headquartered in Latham, New York.
Algorithmic traders utilize these daily forecasts by the I Know First market prediction system as a tool to enhance portfolio performance, verify their own analysis and act on market opportunities faster. This forecast was sent to current I Know First subscribers.
How to interpret this diagram
Algorithmic Stock Forecast: The table on the left is a stock forecast produced by I Know First’s algorithm. Each day, subscribers receive forecasts for six different time horizons. Note that the top 10 stocks in the 1-month forecast may be different than those in the 1-year forecast. In the included table, only the relevant stocks have been included. The boxes are arranged according to their respective signal and predictability values (see below for detailed definitions). A green box represents a positive forecast, suggesting a long position, while a red represents a negative forecast, suggesting a short position.
Please note-for trading decisions use the most recent forecast. Get today’s forecast and Top stock picks.